
Analysis of Bitcoin’s Recent Performance in Relation to Global Monetary Dynamics
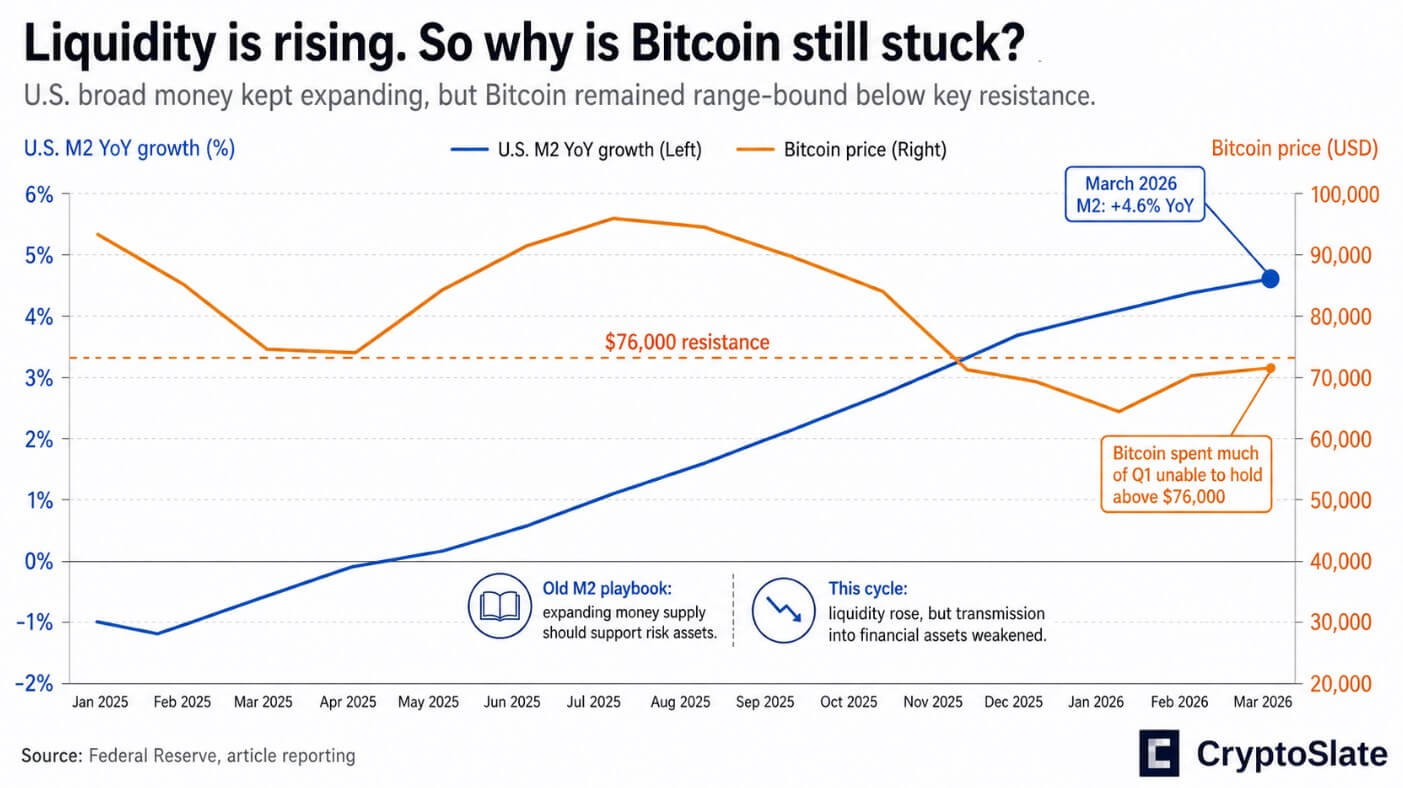
The historical framework surrounding Bitcoin’s valuation has frequently adhered to a straightforward premise: an expansion in the global M2 money supply typically correlates with an influx of capital into risk assets, whereby Bitcoin, as a digital asset, captures an outsized share of this investment. This paradigm was prominently validated during the bull market of 2020-2021, as crypto analysts and enthusiasts extensively utilized M2 overlays to forecast impending bullish movements. However, the current landscape presents a stark contrast; despite ongoing expansion in global M2, Bitcoin has manifested continued underperformance.

Current State of US M2 and Bitcoin Valuation
As of March 2026, the US M2 money supply reached approximately $22.7 trillion, reflecting a year-over-year increase of 4.6%. In stark contrast, Bitcoin’s price struggled to maintain a position above $76,000 during the first quarter—a threshold identified by Jamie Coutts, Chief Crypto Analyst at Real Vision, as critical resistance on CryptoQuant’s Unbiased podcast.
Coutts articulated that the dynamics governing liquidity transmission have evolved. In the post-2008 quantitative easing era, direct asset purchases made by the Federal Reserve flooded the financial system with bank reserves that seamlessly flowed into equities, credit markets, and ultimately into cryptocurrencies. Presently, however, a variety of factors including Treasury issuance, reserve management practices, cash balance fluctuations, and bank credit proliferation have supplanted the central bank’s previous role as a direct liquidity provider.
Examining Structural Challenges: The Plumbing Problem
The United States public debt escalated to over $38.5 trillion by the conclusion of Q4 2025, signifying a year-over-year increase of 6.3%. Concurrently, the growth rate of US M2 stood at 4.6% during the same timeframe. This data reveals a troubling trend where debt accumulation outpaces money supply growth by nearly two percentage points annually. Currently, the total debt stock is approximately 1.70 times greater than total M2—an unprecedented ratio within an ostensibly accommodative monetary environment.
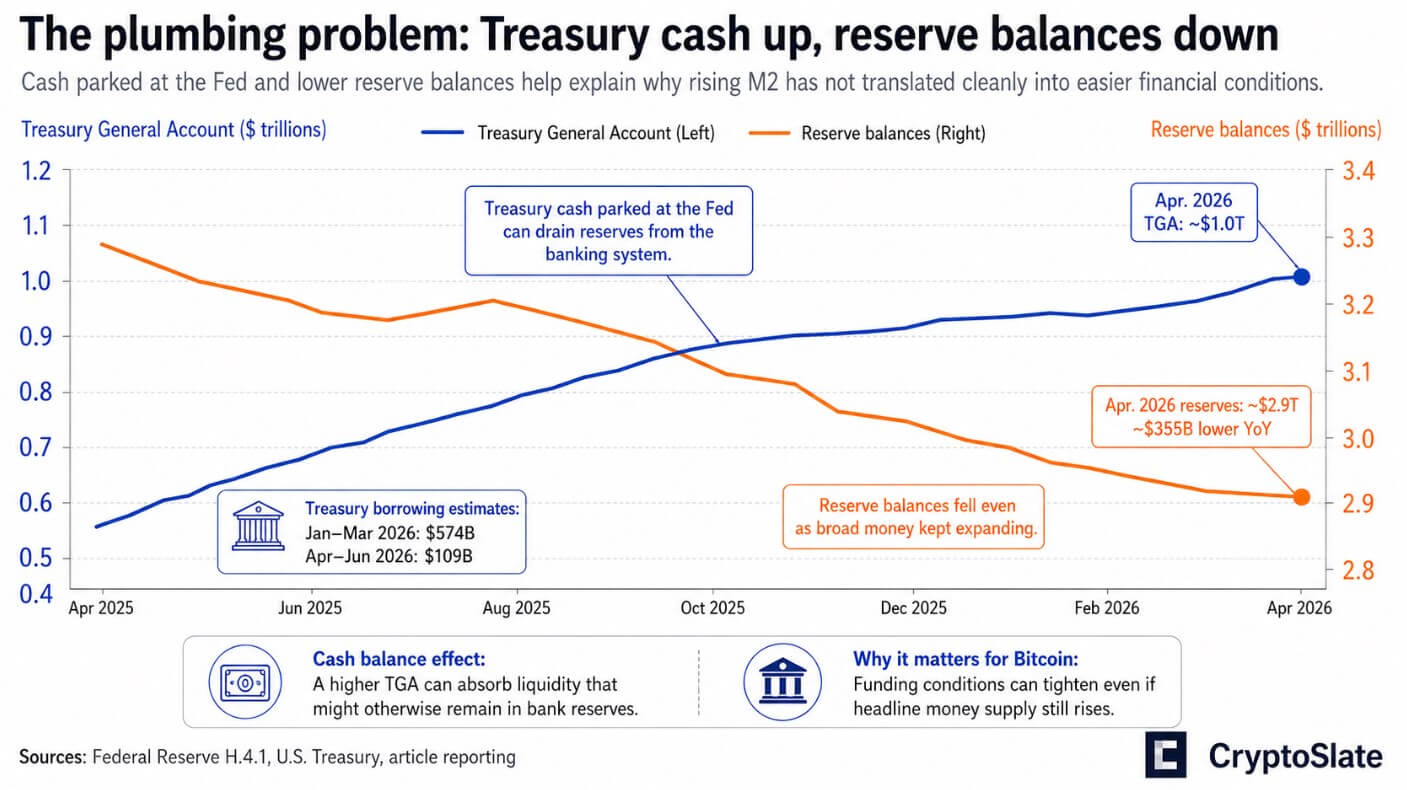
The Treasury’s borrowing estimates forecasted $574 billion in net marketable debt for Q1 2026 and an additional $109 billion for Q2 2026 while simultaneously maintaining a cash balance exceeding $1 trillion. Notably, the Treasury General Account at the Federal Reserve held around $1 trillion according to recent H.4.1 data releases; such cash reserves effectively drain liquidity from the banking sector even as M2 continues its gradual ascent.
Reserve balances have contracted to approximately $2.9 trillion based on the Federal Reserve’s April 22 release—representing a decrease of about $355 billion relative to the previous year. Thus, while broad money appears to be expanding on paper, the underlying mechanisms facilitating reserve movement into financial markets are tightening incrementally.
Bank Credit Dynamics
Despite these systemic constraints, bank credit continues to experience expansion; commercial loans and leases reached approximately $13.7 trillion by mid-April 2026. This augmentation appears directed towards real-economy absorption rather than speculative financial instruments.
During the Federal Open Market Committee (FOMC) meeting on April 29, officials maintained the policy rate within a range of 3.5%-3.75%, with total Federal Reserve assets remaining around $6.7 trillion. Policymakers cited persistent inflationary pressures as their primary concern, indicating no imminent plans for balance sheet expansion.
Decoding the Shift in Historical Correlations
Coutts posited that Bitcoin’s recent lackluster performance can be attributed to friction within financial plumbing mechanisms rather than deteriorating fundamentals related to liquidity itself.
The selloff observed from late 2024 through early 2025 was compounded by several factors: tightening reserve conditions in Q4 due to Treasury dynamics associated with governmental fiscal challenges; deleveraging activity linked to derivatives markets; and an expanding influence of exchange-traded funds (ETFs) and derivatives on Bitcoin’s pricing structure.
These nuanced dynamics are not captured within traditional overlays of global M2 money supply; they represent aspects of a financial system where Treasury supply intricacies and reserve management have emerged as critical battlegrounds influencing asset valuations.
The performance of gold serves as an illustrative cross-market confirmation of these trends; central banks acquired 244 tonnes of gold in Q1 2026—an increase of 3% year over year—with total demand reaching an unprecedented value exceeding $193 billion according to data from the World Gold Council.
Imminent Fiscal Challenges and Debt Trajectories
Official institutions appear to be hedging against sovereign debt credibility through substantial gold acquisitions—an asset category that central banks are legally permitted to hold. The International Monetary Fund (IMF) has projected that global public debt will approach 100% of GDP by 2029, primarily driven by developments in both the United States and China.
The Congressional Budget Office anticipates a federal deficit amounting to $1.9 trillion for FY2026 alongside projections indicating that publicly held debt will escalate from roughly 101% of GDP to approximately 120% by 2036—a structural oversupply that will invariably compete with risk appetite for available reserves and capital.

Potential Outcomes for Bitcoin: Bullish vs Bearish Scenarios
The emerging landscape presents two divergent pathways for Bitcoin’s valuation:
| Factor | Bull Case | Bear Case |
|———————-|—————————————————————–|—————————————————————|
| Inflation | Cools toward Fed’s projected trajectory | Remains sticky enough to maintain cautious policymaking |
| Treasury Cash Balance | Declines, alleviating reserve drain | Stays elevated, continuing liquidity absorption |
| Reserve Balances | Rebuild from current levels | Remain tight or diminish further |
| Debt Issuance | Manages relative to liquidity growth | Heavy issuance outpaces liquidity growth |
| Fed Stance | Can ease or soften without triggering inflation | Cannot ease significantly without risking renewed inflation |
| Bank Credit | Expands robustly without triggering growth concerns | Expands weakly or is counterbalanced by tighter funding |
| Financial Conditions | Loosen marginally | Remain restrictive with potential stress episodes |
| Market Plumbing | Treasury supply and reserves cease acting as headwinds | Treasury funding strain and reserve friction persist |
| Bitcoin Behavior | Re-rates higher as liquidity thesis regains traction; maintains value floor at ~$60K | Trades like high-beta asset subject to significant drawdowns |
In this context, Coutts delineates between Bitcoin’s long-term monetary potential versus its medium-term price behavior driven by prevailing reserve flows.
The crux of investor considerations lies in whether current liquidity expansions will suffice to concurrently absorb outstanding debt obligations and mitigate pressures stemming from Treasury supply dynamics.
Until such time as both debt metrics and reserve conditions exhibit favorable shifts conducive to Bitcoin’s appreciation, market participants can expect continued volatility characterized by pronounced drawdowns amid a challenging funding landscape.