
preferred on
Market Analysis of Bitcoin’s Recent Price Movements
In the wake of the announcement regarding the ceasefire among the United States, Israel, and Iran, Bitcoin (BTC) experienced a notable price surge, escalating from approximately $67,000 to $72,000. This 7.5% rebound contributed to a significant reduction in market volatility and subsequently elevated overall sentiment towards risk assets.
Market Sentiment and Technical Analysis
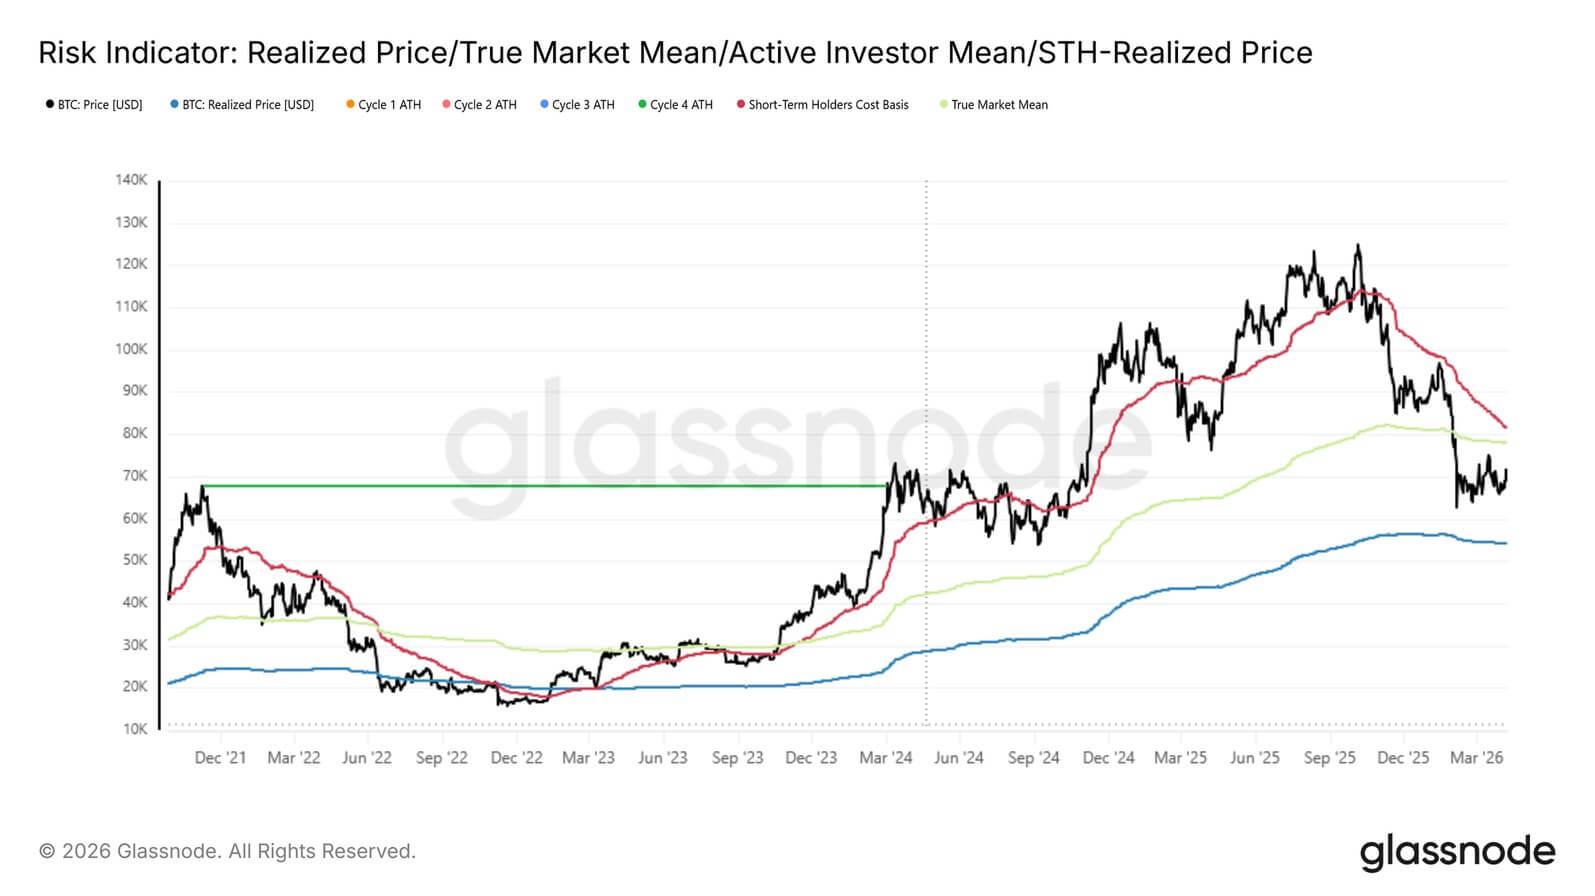
According to Glassnode’s “Week On-chain Report,” published on April 8, this rebound and subsequent stabilization continue to exhibit characteristics typically associated with bear market recoveries. As it currently stands, BTC remains entrenched within a bear market valuation framework, with a critical threshold identified at $81,600. This price point represents the Short-Term Holder Cost Basis, an aggregate breakeven price for Bitcoin acquisitions made in recent months.
Glassnode emphasizes that reclaiming this pivotal level is essential for any rally to be deemed sustainable. Below this threshold, recent purchasers collectively endure losses; thus, any upward movements toward this level are likely to face selling pressure from holders who are eager to exit their positions near breakeven.
Impact of Geopolitical Developments on Market Volatility
The aforementioned ceasefire has mitigated macroeconomic shocks, resulting in compressed volatility within options markets. Short-dated implied volatility has subsided into the low 40s, while six-month tenors have settled around 45%. However, as reported by Reuters on April 9, the truce appears precarious; oil prices rebounded and broader market risk sentiment weakened within just one day following the announcement.
Market Dynamics: Key Metrics
Glassnode’s analytical framework elucidates a precise trajectory for BTC price movements. The trading range of $69,000 to $71,500 indicates significant dealer positioning with long gamma concentration—this mechanical structure may provide support against imminent selling pressure.
As BTC currently trades just above $72,000, it exceeds the upper boundary of this support zone. The True Market Mean is positioned at $78,000—representing an approximate ceiling for any potential relief rally. Furthermore, Glassnode’s AVIV Ratio stands at 0.92, remaining below the critical threshold of 1.0 since early February. This metric mirrors conditions observed during the bear markets of May and June of 2022 but is significantly above the capitulation extremes recorded in late 2022.
The prevailing setup suggests that we are experiencing a bounce within an ongoing bear market phase—characterized by identifiable floors and ceilings along with an essential resistance level above.
Volume Analysis and Market Participation
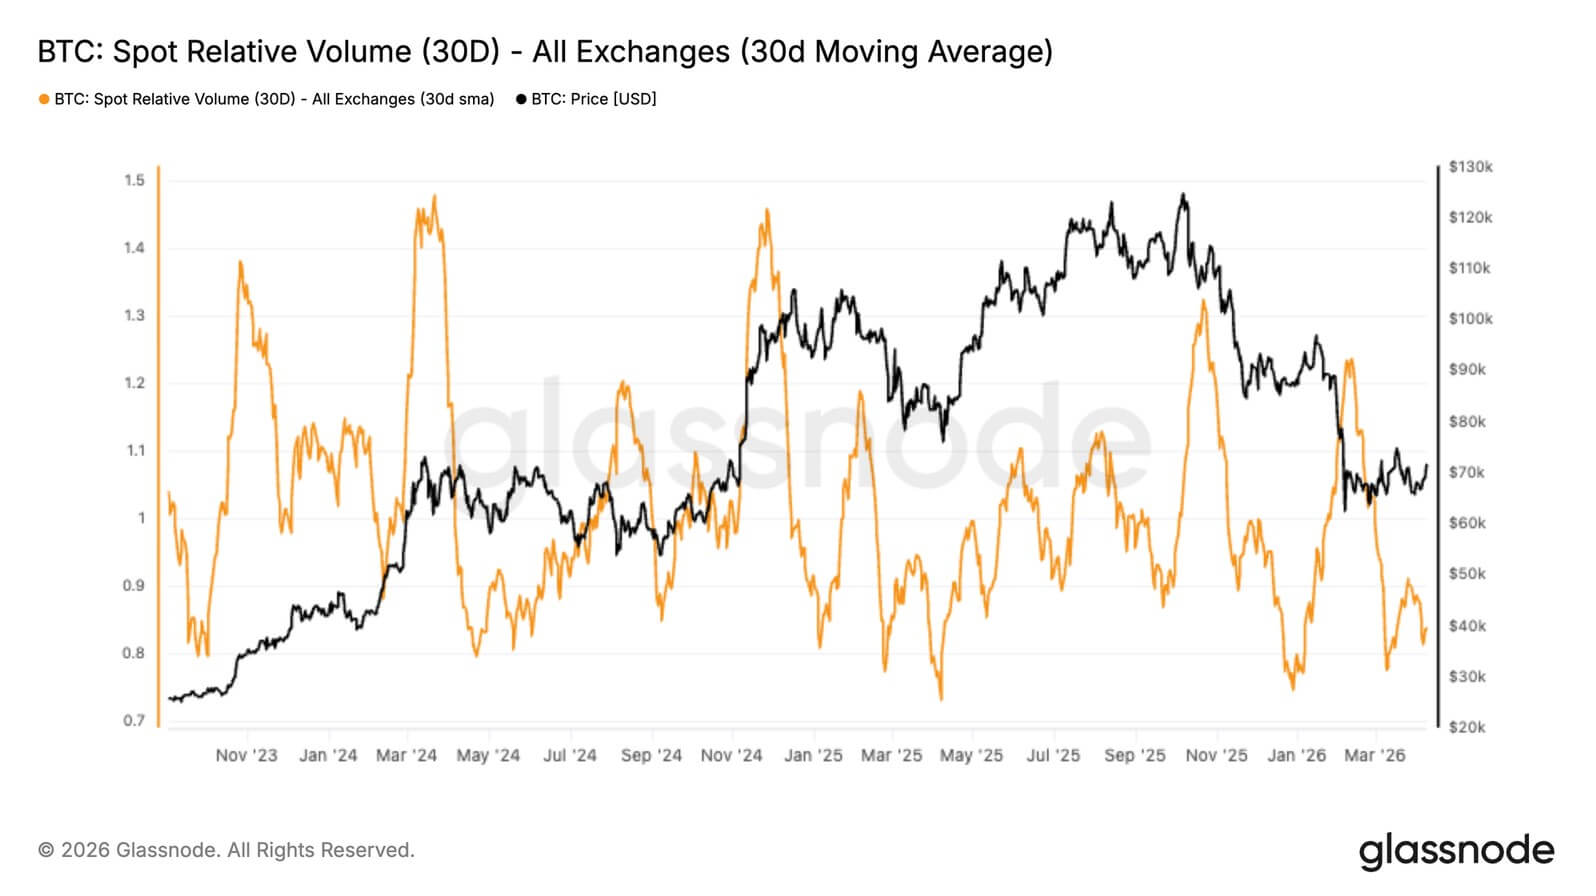
The liquidity landscape reveals that Binance’s relative spot volume over a thirty-day period has remained below its baseline of 1.0—an indication of weak organic demand. Despite US spot ETF flows turning modestly positive over a fourteen-day window, recent prints on April 7 and April 8 still reflected negative trajectories.
Moreover, futures volume has contracted sharply over a thirty-day horizon while the skew in options pricing continues to favor puts—suggesting that traders are willing to pay premiums for downside protection. Collectively, these indicators paint a picture of a market stabilizing amid thin participation.
Structural Integrity of Relief Rally
The analysis from Glassnode indicates that the market has transitioned into a more balanced state where the risk of catastrophic downside appears diminished. A gradual ascent toward $78,000 seems plausible; however, its sustainability remains uncertain. The crux of this issue lies in whether buyers are actively absorbing or merely distributing holdings.
Below the critical level of $81,600, recent investors are sustaining losses which impose constraints on upward momentum. Each rally toward breakeven offers exit opportunities for those who accumulated positions at inflated valuations during prior peaks.
Glassnode elucidates this mechanism by asserting that distribution pressures from trapped holders render rallies within the current range particularly susceptible to failure.
Long-Term Holder Behavior and Market Signals
Long-term holders have realized daily losses exceeding 4,000 BTC since November 2025. A reduction of this figure to less than 1,000 BTC per day—coupled with a reclamation of $81,600—would serve as a definitive on-chain signal indicating a potential regime shift in market dynamics.
Conclusions Regarding Geopolitical Influences and Market Sentiment
The macroeconomic landscape establishes an upper limit on sentiment-driven demand within cryptocurrency markets. The US-Israel-Iran ceasefire has effectively compressed volatility; however, it has not catalyzed substantial rebuilding of risk appetite as indicated by subsequent fluctuations in oil prices—a phenomenon that underscores the transient nature of geopolitical relief rallies.
As acute fears dissipate, underlying demand structures are likely to reassert themselves. Current data from Glassnode reveals that these fundamental structures remain tenuous at best.
The current realized volatility at approximately 42.5% alongside low implied volatility metrics delineates a tranquil market yet to exhibit bullish characteristics decisively. For sustainable breakouts to materialize, crucial conditions such as expanding trading volumes and improved ETF inflows must be met—a scenario that is yet to manifest according to recent data.
For now, Bitcoin appears to have established sufficient footing for a short-term bounce; however, without reclaiming levels above $81,600, it remains ensconced within a bearish structural framework where participants inclined to liquidate their holdings during future rallies are predominantly those who have been underwater since previous peaks.