


preferred on
Current Market Dynamics: Bitcoin’s Position amidst Economic Indicators
As of May 6, Bitcoin has stabilized above the $82,000 threshold, amidst a backdrop characterized by fluctuating oil prices, Treasury yields, the U.S. dollar, and stock indices—elements that have rendered investors increasingly fatigued after recent tumultuous months.
This resurgence in Bitcoin’s price reopens the discourse surrounding its function as an inflation hedge, albeit without providing definitive resolution. Furthermore, it raises questions regarding the assertion that Bitcoin has definitively decoupled from traditional equities.
The current market structure presents a notably compressed scenario. At the time of writing, data from CryptoSlate indicates Bitcoin trading in proximity to $82,000, with a market dominance of approximately 60.4% and a 24-hour trading volume exceeding $40 billion.
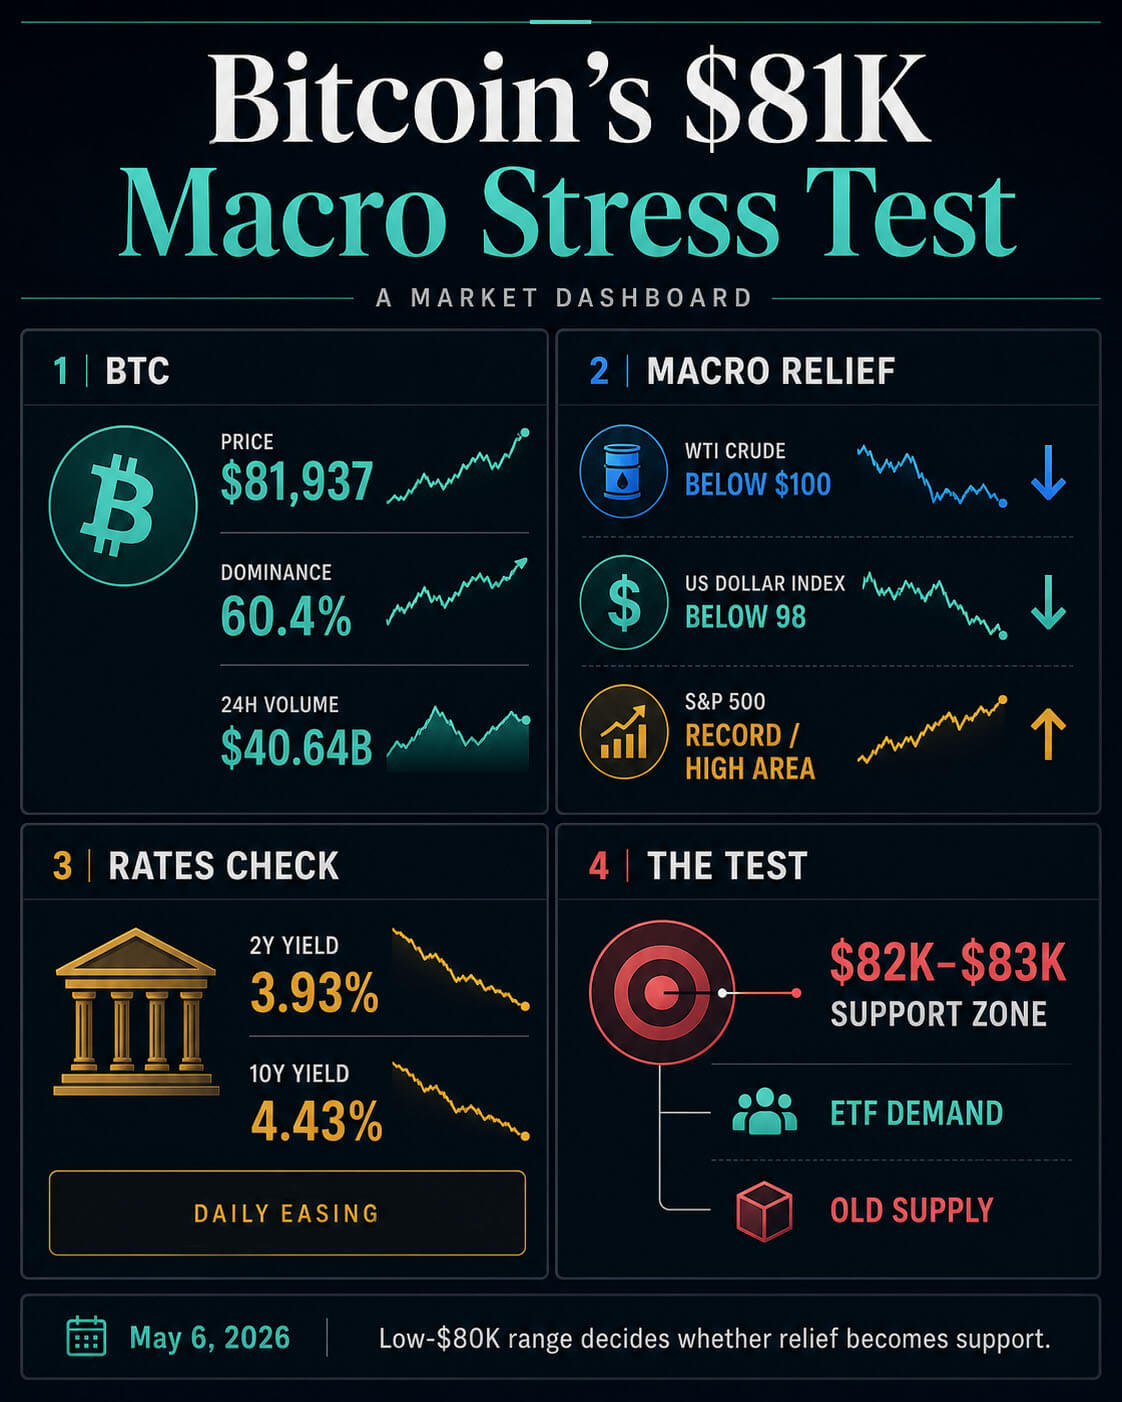
Parallel to Bitcoin’s movements, West Texas Intermediate (WTI) crude oil prices have dipped below $100, while the U.S. Dollar Index (DXY) has settled under the 98 mark. According to official Treasury data, both two-year and ten-year yields have experienced a reduction compared to previous daily metrics, coinciding with the S&P 500 nearing its all-time high.
The resultant market landscape presents dual interpretations: Bitcoin may indeed be attracting conditional demand from investors seeking a liquid hedge against macroeconomic and geopolitical instability. Alternatively, it could be traversing various phases of the risk cycle influenced by ETF demand dynamics, technology sector risk appetite driven by Asian markets, oil market developments, and fluctuations in dollar strength.
Interpreting Macro Signals: Market Contextualization
The macroeconomic backdrop has exhibited rapid improvements; however, each facet conveys distinct implications. A decline in crude oil prices below the $100 mark alleviates immediate inflationary pressures previously exacerbated by soaring oil prices. Concurrently, a depreciating dollar renders dollar-denominated risk assets more accessible to investors.
Notably, the S&P 500’s ascendance towards record highs indicates an enduring appetite for traditional risk assets. In contrast, Treasury yields have shown only marginal easing on a daily basis for both two-year and ten-year maturities despite presenting more pronounced intraday fluctuations.
This distinction bears significance as an exaggerated interpretation of bond market movements could undermine arguments supporting Bitcoin’s decoupling from equities—a narrative gaining traction across social media platforms.
Recent analyses from CryptoSlate framed this situation as a potential divergence from the SPY index; however, it also cautioned that such divergence might be reflective of varying lead markets and trading sessions.
Presently, Bitcoin operates at the nexus of multiple macroeconomic indicators—oil price volatility, interest rates, dollar strength, ETF demand dynamics, and pre-existing supply pressures being sold into upward price movements.
| Signal | Implication | Caveat |
|---|---|---|
| BTC above $81,000 | Indicates buyer defense in the low-$80K region | Requires confirmation of support within $82K-$83K range |
| WTI below $100 & DXY below 98 | Easing macro pressure on risk assets | Highly sensitive to headlines; potential for quick reversals |
| S&P 500 near record highs | Continued risk appetite outside cryptocurrency markets | Complicates assertions of equity decoupling |
| ETF inflows & profit-taking | New demand is counterbalancing existing supply | The rally necessitates ongoing absorption above $80K |
| Weak-demand frameworks | Persistent bear-market risks remain | On-chain signals require improvement for trend validation |
The aforementioned table elucidates why recent movements should be interpreted as a rigorous stress test rather than a definitive declaration of new trends. While Bitcoin displays sufficient strength to warrant reassessment, each bullish indicator is accompanied by inherent caveats.
Although macroeconomic relief assists Bitcoin’s position, traditional stock indices continue to perform robustly. While ETF inflows contribute positively to market dynamics, long-term holders are capitalizing on elevated prices to liquidate positions. Furthermore, while some on-chain metrics have shown improvement, recent trends underscore that demand and validation for sustainable market movements still require further substantiation.
The Role of ETF Demand in Market Dynamics
The bullish narrative hinges significantly on absorption dynamics within the market. Long-term holders have been strategically distributing their holdings into periods of strength while spot Bitcoin ETFs recorded inflows exceeding $1.1 billion during the initial two trading days of May.
This influx represents a substantial signal that transcends mere headline price movements; Bitcoin can achieve upward momentum through resistance levels when fresh demand consistently offsets older supply dynamics.
The presence of ETF demand alters the structural landscape of market recoveries. Spot funds provide brokerage account holders with a regulated mechanism to increase exposure without necessitating direct engagement with exchange custody and wallet management complexities.
Such demand can persist even amidst softening on-chain metrics. In scenarios like the current one—characterized by weak-demand frameworks—rising prices can coexist longer than they would in markets predominantly influenced by native exchange flows.
Traders are closely monitoring levels above $81,000 as this zone has been treated as both a recovery threshold and a seller resistance point over recent weeks. A decisive push above this level signifies robust demand; however, maintaining stability above the $82K-$83K range would send an even stronger signal: buyers are successfully converting prior resistance into foundational support rather than merely reacting to transient macroeconomic relief.
Furthermore, the ETF framework sharpens focus on institutional participation. While it may be tempting to characterize recent price movements as indicative of widespread institutional resurgence, prevailing evidence suggests that it is predominantly ETF-driven demand fueling these trends.
While ETF inflows can exert powerful influences over price trajectories and establish tactical investment strategies, they may also dissipate swiftly should macroeconomic conditions shift unfavorably or if volatility escalates—particularly if price stagnation aligns with long-term holders’ willingness to liquidate their positions.
This renders flow persistence a crucial determinant in future price movements. While a singular strong inflow episode may facilitate price elevation through congested levels, sustained breakouts necessitate continuous absorption following initial relief-driven bids.
If ETF inflows consistently meet selling pressure above $80K, this range could evolve into a solid base; conversely, if these flows stall while long-term holders continue distribution strategies, this same threshold could revert to acting as resistance.
The Persisting Question of Bull-Trap Risks
A compelling argument against pursuing current bullish momentum stems from the observation that price appreciations have outpaced some underlying demand indicators.
Previous analyses conducted by CryptoSlate highlighted weak demand characteristics alongside subdued liquidity conditions and moving-average constraints; these elements suggest that trend reclamation is necessary before declaring any significant market reversal.
Moreover, Glassnode’s late-April on-chain assessments also emphasized stress levels related to cost bases and holder behaviors clustered around the $79K-$80K zone.
This rebound may appear legitimate; however, buyers bear the burden of proof regarding sustaining momentum. It is essential to recognize that bear-market rallies can appear convincing when driven by short covering mechanisms or tactical ETF inflows alongside relief stemming from decreasing dollar values.
The situation becomes more difficult to dismiss when multiple conditions coalesce: price stabilization above resistance levels occurs concurrently with positive ETF demand trends while distribution pressures diminish and downside hedging activities decrease due to reduced perceived necessity among traders.
This aligns with ongoing discussions surrounding Bitcoin’s role as an inflation hedge amidst favorable conditions concerning oil prices and geopolitical stability affecting liquidity flows within markets.
Nevertheless, historical correlation analyses indicate caution against hastily categorizing Bitcoin within a gold-like paradigm—a designation rarely suited for premature declarations.
The prevailing setup reinvigorates debates concerning hedging capabilities but leaves definitive conclusions pending future developments. Should oil pressures subside while Bitcoin maintains its positioning within low-$80K ranges amid faltering equities performance patterns—this would substantiate arguments against equity-based bids being primary drivers behind BTC’s pricing actions.
Conversely, if Bitcoin retraces upon confronting subsequent macroeconomic headlines—a scenario reminiscent of classic high-beta risk rallies—the underlying narrative will invariably shift back towards traditional bear-market explanations where selling pressures prevail at anticipated thresholds within low-$80K ranges.
As such, monitoring performance within the critical $82K-$83K range becomes paramount: confirming support at this juncture would not inherently validate Bitcoin’s renewed status as an inflation hedge but would signify buyers’ capacity to absorb selling pressures while navigating evolving macroeconomic landscapes.
Should this level fail to establish itself as support—the trajectory would revert back towards simplistic interpretations where Bitcoin’s rally was merely alleviated by relief measures before encountering pre-existing bear-market selling pressures.


