
preferred on
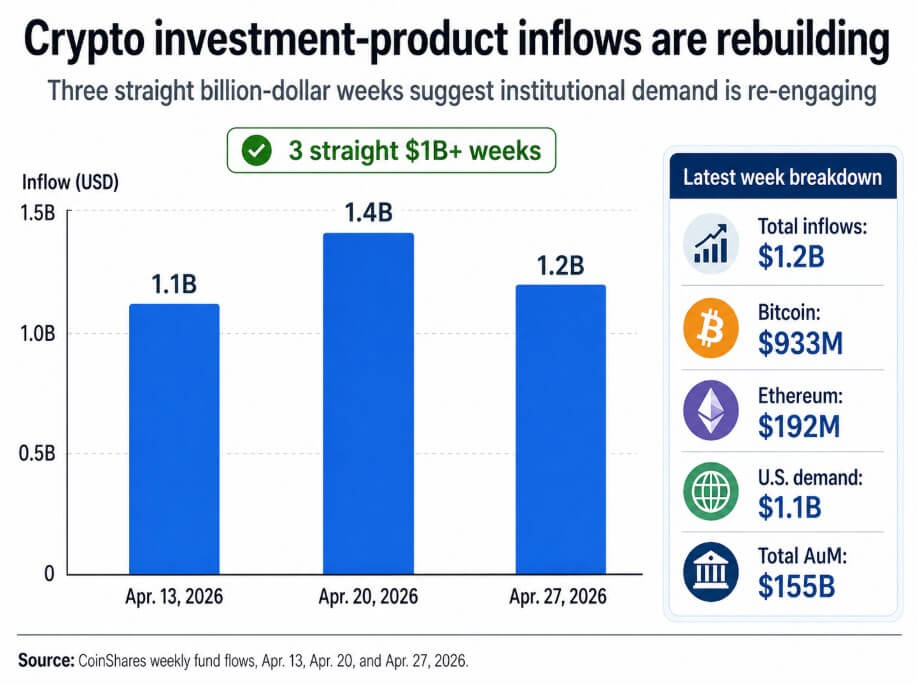
In the context of the ongoing evolution within the cryptocurrency landscape, recent data indicates that crypto investment products have witnessed a notable influx of $1.2 billion over the past week. This development marks a significant continuation of a positive trend, characterized by three consecutive weeks of inflows surpassing the $1 billion threshold, thus underscoring an overall fourth week of positive performance.
Analysis of Investment Inflows
According to empirical data provided by CoinShares, Bitcoin has been the primary beneficiary of this influx, attracting approximately $933 million, while Ethereum contributed an additional $192 million. Notably, the United States has been a significant driver of this momentum, accounting for about $1.1 billion in regional demand. Consequently, total assets under management (AUM) have escalated to $155 billion, representing the highest valuation since February 1, although still falling short of the peak AUM recorded in October 2025 at $263 billion.
CoinShares attributes this sustained inflow streak to a discernible improvement in institutional demand. However, it also highlights potential caution stemming from the Federal Open Market Committee (FOMC) meeting scheduled for April 28-29.
Demand Dynamics
The observed inflow data aligns with various signals emanating from multiple channels, distinguishing it from isolated reporting anomalies. For instance:
– The Chicago Mercantile Exchange (CME) reported a year-over-year increase in average daily volume for crypto derivatives, surging from 191,000 to 310,000 contracts in Q1. Furthermore, average daily open interest reached 313,900 contracts, reflecting a substantial increase of 25% relative to Q1 of the previous year.
– Elevated open interest levels suggest prolonged capital retention within the marketplace, indicating that market participants are adopting longer-term positioning strategies.
– Additionally, blockchain equity exchange-traded funds (ETFs) have realized inflows totaling $617 million over the past three weeks. This reinforces the notion that institutional investors are not only acquiring direct cryptocurrency positions but are also seeking exposure to underlying infrastructure.
– Corporate treasury accumulation continues along its trajectory. Notably, Strategy’s filing with the SEC on April 27 revealed an acquisition of an additional 3,273 BTC during the period from April 20 to April 26, raising its cumulative total to 818,334 BTC at a remarkable aggregate cost of approximately $61.8 billion.
Furthermore, Hong Kong-listed Bitfire is ambitiously targeting over 10,000 BTC for its regulated “Alpha BTC” strategy within the upcoming year. Meanwhile, Avenir maintained an impressive position with $908 million in BlackRock’s IBIT at the conclusion of 2025.
The geographic diversification—encompassing U.S. corporate treasuries alongside regulated Asian asset management and global investment products—contributes to a structural quality within this demand recovery that transcends what could be inferred from isolated weekly inflow reports.
Moreover, DefiLlama estimates that the total market capitalization for stablecoins stands at approximately $320.7 billion—signifying a modest increase of 1.73% over the preceding month—thereby expanding the infrastructural capabilities for capital deployment into Bitcoin.
Market Structure Considerations
The prevailing market structure adds another layer of complexity that precludes any straightforward interpretation of demand recovery as having reached a state of resolution.
According to Glassnode’s report dated April 22, Bitcoin has reclaimed its position above the True Market Mean at approximately $78,100. The cost basis for short-term holders is now established at $80,100—this figure currently acts as an immediate resistance ceiling.
ETF flows have again turned modestly positive while spot demand exhibits preliminary signs of recovery. Notably, Glassnode reported that short-term holders are realizing profits at an impressive rate of $4.4 million per hour—nearly threefold compared to the previous threshold of $1.5 million that characterized prior local tops this year.
This rate indicates that recent buyers are locking in gains at a pace with which the market has historically struggled to cope without experiencing meaningful pauses or retracements.
Glassnode’s analysis signifies that Binance’s cumulative volume delta (CVD) has been central to recent buying activity; conversely, trading activity on Coinbase—typically regarded as a primary venue for U.S. institutional spot transactions—has remained relatively subdued.
This disparity suggests that recovery driven predominantly by offshore retail and mid-tier funds may render bid support less stable than implied by headline inflow figures.
An examination of Farside Investors’ daily U.S. ETF data corroborates this observation from an alternative perspective: spot Bitcoin ETFs experienced positive flows for nine consecutive trading sessions—surpassing $2 billion—before experiencing a downturn on April 27.
This juxtaposition reveals that while three weeks of billion-dollar inflow readings and a subsequent single-day reversal can coexist as valid phenomena, they collectively illustrate a demand recovery that is directionally authentic yet remains sufficiently fragile to succumb to macroeconomic catalysts.
| Improving Signals | Fragility Signals |
|---|---|
| ETF flows have turned modestly positive again | $80.1K serves as immediate resistance |
| Spot demand exhibits early signs of recovery | Realized profit has surged to $4.4M/hour |
| Bitcoin has reclaimed its position above the True Market Mean at $78.1K | Coinbase activity remains comparatively muted |
| Three consecutive weeks witness inflows exceeding $1B | The risk associated with profit-taking rises as buyers begin to realize gains |
The upcoming FOMC meeting on April 28-29 presents itself as a critical juncture for determining whether the institutional bid established over preceding weeks can sustain its footing.
CoinShares has explicitly linked current investor caution to this decision-making window; concurrently, Glassnode’s market structure insights elucidate that Bitcoin is navigating towards the resistance zone at $80,100—a level at which over 54% of recent buyers would be positioned profitably—a historically significant threshold where distribution selling frequently culminates bear market rallies.
A Federal Reserve outcome that maintains financial conditions relatively unchanged would mitigate immediate macroeconomic headwinds; conversely, any hawkish surprise or indications tightening rate-cut timelines could furnish sellers with an external impetus to capitalize on elevated profit margins.
The Dual Pathways Forward
The bullish scenario hinges upon several critical factors:
– The Federal Reserve refraining from introducing additional macroeconomic stress.
– Sustained weekly product inflows maintaining levels near or exceeding $1 billion.
– A resurgence in U.S. ETF demand following any fluctuations observed around April 27.
– An uptick in Coinbase spot activity closing gaps relative to offshore trading venues.
If these conditions materialize and Bitcoin decisively surpasses the pivotal resistance level at $80,100 with accompanying consistent spot absorption, it would signify a transition in market structure from “rally on trial” to a confirmed demand regime—thereby engaging another tier of institutional allocators who have been awaiting robust confirmation in price structures corresponding with flow data.
In such circumstances, previous peaks in AUM recorded in October 2025 at approximately $263 billion would serve as pertinent reference points—potentially recasting this three-week inflow streak as an initial phase leading toward sustainable re-engagement within institutional frameworks.
The bearish scenario posits a contrasting narrative wherein these same variables operate inversely:
– A tightening by the Federal Reserve could precipitate negative adjustments in financial conditions.
– A breakdown in weekly flow streaks could ensue.
– The warning regarding realized profits from Glassnode may begin dominating price actions.
– Bitcoin may falter below both key levels at $80,100 and subsequently $78,100.
This trajectory would suggest that recent movements could be interpreted as another distribution rally rather than indicative of durable recovery trends—especially given prevailing thin liquidity conditions which could exacerbate downward movements beyond what positive inflow data might otherwise predict.
With current total AUM resting at approximately $155 billion—a striking contrast representing a deficiency of about 41% compared to October peaks—the implications concerning unwound institutional exposures at higher price levels become increasingly salient.
| Scenario | Trigger | What Confirms It | What Breaks It | Why It Matters |
|---|---|---|---|---|
| Bull Case | The Fed passes without adding fresh macro stress | Weekly digital asset investment product inflows remain near or exceed $1B; U.S. spot Bitcoin ETF demand reaccelerates post-April 27 wobble; Coinbase spot activity narrows gap with offshore venues; Bitcoin surpasses $80,100 with sustained spot absorption. | A hawkish Fed statement; declining ETF flows; renewed offshore-only buying; failure to break above $80,100. | This confirms recent inflow trends as initiating more durable institutional re-engagement and positions Bitcoin for upward challenges against prior reference levels including $263B, marking October’s peak AUM. |
| Base Case | The Fed maintains neutrality without materially altering financial conditions. | Weekly flows remain positive but below previous pace exceeding $1B+; ETF flows exhibit variability; Bitcoin sustains above $78,100, yet struggles decisively against $80,100. | A marked downturn in ETF demand; escalating profit-taking; breakdown below key support levels including $78,100. | This indicates that institutions are re-engaging but lack sufficient conviction to transition into fully confirmed demand regimes. |
| Bear Case | The Fed tightens conditions marginally or signals less accommodating rate trajectories. | The weekly flow streak deteriorates; ETF demand diminishes; domination by Glassnode’s realized profit warnings begins affecting price dynamics; Bitcoin fails above both critical levels ($80K and $78K). | A dovish or neutral Fed outcome; renewed momentum in weekly inflows exceeding $1B+; increased participation from Coinbase; reclaiming stability above $80K. | This reframes recent price movements as distribution rallies rather than signs of robust recovery—as thin liquidity challenges suggest accelerated downside risks beyond initial predictions based solely on inflow metrics. |
The confluence of CoinShares’ sustained billion-dollar weekly inflows alongside CME’s increased open interest metrics and persistent corporate treasury accumulation reflects an environment wherein capital is returning to Bitcoin with enhanced conviction. The breadth and depth across various channels lend credence against characterizing these trends merely as singular venue anomalies; ultimately it will be determined by forthcoming Federal Reserve decisions whether this momentum can endure and evolve into a sustainable market recovery paradigm.