
Analysis of Current Trends in Ethereum Market Dynamics
Recent developments within the Ethereum (ETH) market have exhibited a marked resurgence in bullish sentiment among traders, as evidenced by an uptick in demand for derivatives products that facilitate upside exposure. According to data sourced from CryptoSlate, ETH has appreciated approximately 11% this month, marking a significant turnaround characterized by a four-week growth streak—the longest observed in nearly one year.
This upward trajectory has propelled ETH’s valuation to approximately $2,330, representing its highest price point since February of this year and positioning it for its first consecutive monthly increase since the period of July to August 2025. The renewed price momentum has refocused investor interest back toward the $3,000 threshold following a protracted period of underperformance relative to Bitcoin.
Strategic Positioning in Ethereum Options Market
Deribit, recognized as the premier venue for cryptocurrency options trading, is emerging as a prominent indicator of renewed bullish sentiment. Data harvested from this trading platform indicates a substantial accumulation of open interest in ETH call options centered around the $3,200 strike price, amassing over $322 million in outstanding contracts. The $2,500 strike option closely follows with approximately $320 million in open interest.
Call options confer upon traders the right—yet not the obligation—to purchase an asset at a predetermined price, thereby gaining value as the underlying asset approaches the strike price. The concentration of activity around both the $2,500 and $3,200 strikes suggests that traders are re-establishing positions anticipating a breach beyond the current recovery levels. It must be noted that elevated open interest does not inherently signify unalloyed bullish intentions; rather, it may encompass hedging activities, spread trades, volatility strategies, and market-maker exposures.
Inflow Trends of Ethereum Exchange-Traded Funds (ETFs)
The recent performance metrics for U.S. spot Ethereum exchange-traded funds (ETFs) have provided compelling signals indicative of heightened demand prior to the rally, which subsequently encountered a pause. Data from SoSo Value illustrates that ten funds collectively attracted over $633 million during a ten-day inflow streak commencing on April 9 and culminating on April 22—this being the longest streak recorded for this year and since June 2025.
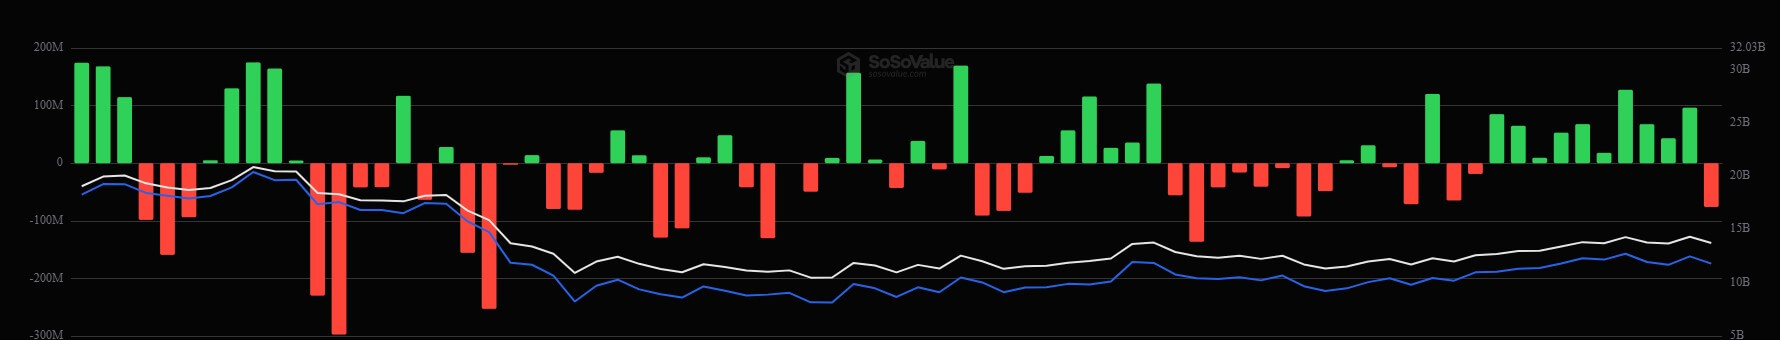
Nevertheless, this inflow streak was interrupted on April 23, with funds registering net outflows amounting to approximately $75.94 million—the first negative session since early April. Despite this setback, the inflow trend bolsters the perspective that institutional investors are gradually re-engaging with Ethereum exposure after a period wherein Bitcoin had garnered predominant institutional interest. ETF flows are particularly scrutinized as they reflect demand through spot products rather than through leveraged positions prevalent in derivatives markets.
Additional corroboration of this trend is provided by Alphractal’s data indicating that their proprietary Ethereum Smart Money Flow Index—a measure of institutional engagement with ETH—has demonstrated positive divergence from price over several weeks. This observation implies an enhancement in fund demand preceding greater visibility in spot price recovery.
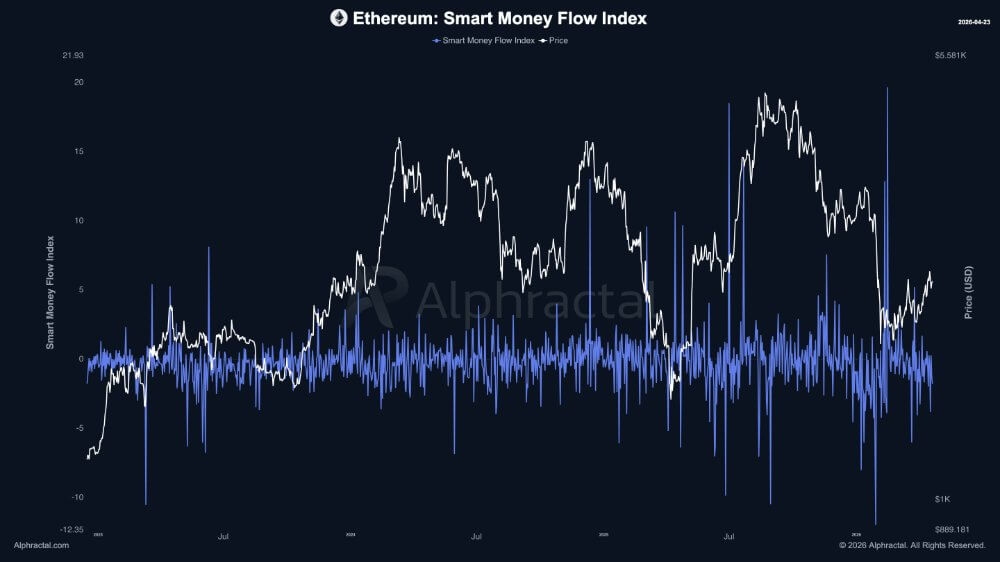
However, the recent outflow serves as a cautionary note that Ethereum has not yet achieved the level of ETF-driven consistency that has supported Bitcoin during pronounced rallies. While improvements in fund flows for ETH are evident, they have yet to reach a threshold capable of independently sustaining market momentum.
Market Demand Indicators Reflect Gradual Recovery
In conjunction with sustained inflows from ETFs, order-flow data from Binance indicates a measured recovery in demand rather than aggressive accumulation strategies. According to CryptoQuant’s analysis, Binance’s Cumulative Volume Delta (CVD) recently recorded a positive figure near 48,400. This metric tracks net differences between buying and selling volumes; consequently, a positive reading signifies an excess of buy orders compared to sell orders.
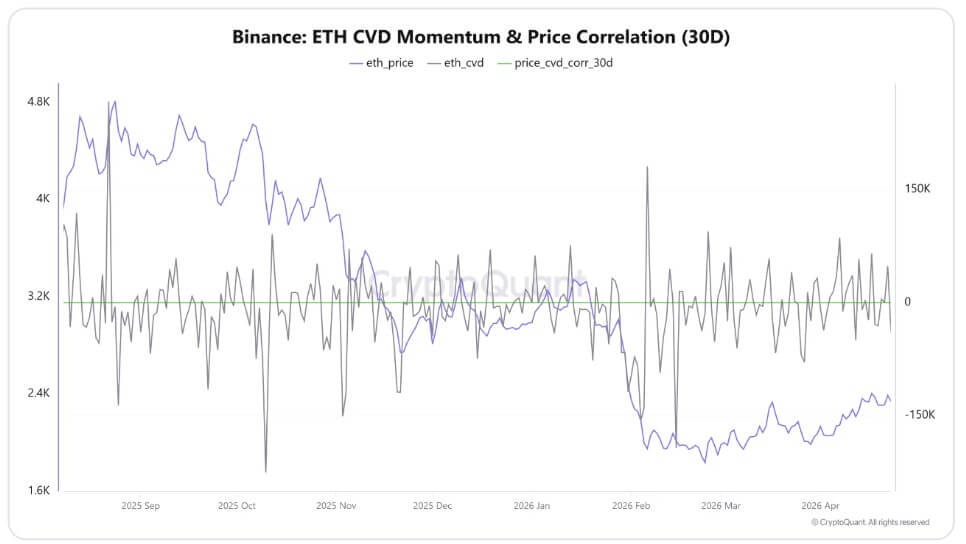
This development suggests that the recent appreciation in ETH value is not merely attributable to speculative leverage but is indeed reflective of buyers re-entering the market—this dynamic has contributed to stabilizing the asset following prior declines. Furthermore, there is an observable strengthening correlation between ETH’s price movements and order flow dynamics; currently indicated by a correlation coefficient of approximately 0.66—representing a moderately strong relationship between buying activity and price fluctuations.
Nonetheless, caution persists as ETH remains positioned below previous highs; moreover, CVD readings do not exhibit the vigorous accumulation typically associated with confirmed bullish breakouts. Rather, these indicators suggest an ongoing rebalancing phase following earlier periods of weakness. Consequently, the sustainability of an upward trajectory for ETH hinges on whether improvements in order flow can maintain momentum.
The Implications of Rising Leverage on Ethereum’s Market Stability
Despite favorable metrics indicating potential bullish dynamics within the market landscape for ETH, data from CryptoQuant reveals an escalating risk factor underpinning the current rally—specifically concerning leverage ratios on Binance. The leverage ratio has surpassed spot price levels for the first time in several months; when leverage expands at a rate exceeding spot price increases, it indicates that traders are engaging in greater borrowed exposure compared to outright purchases of ETH by investors.
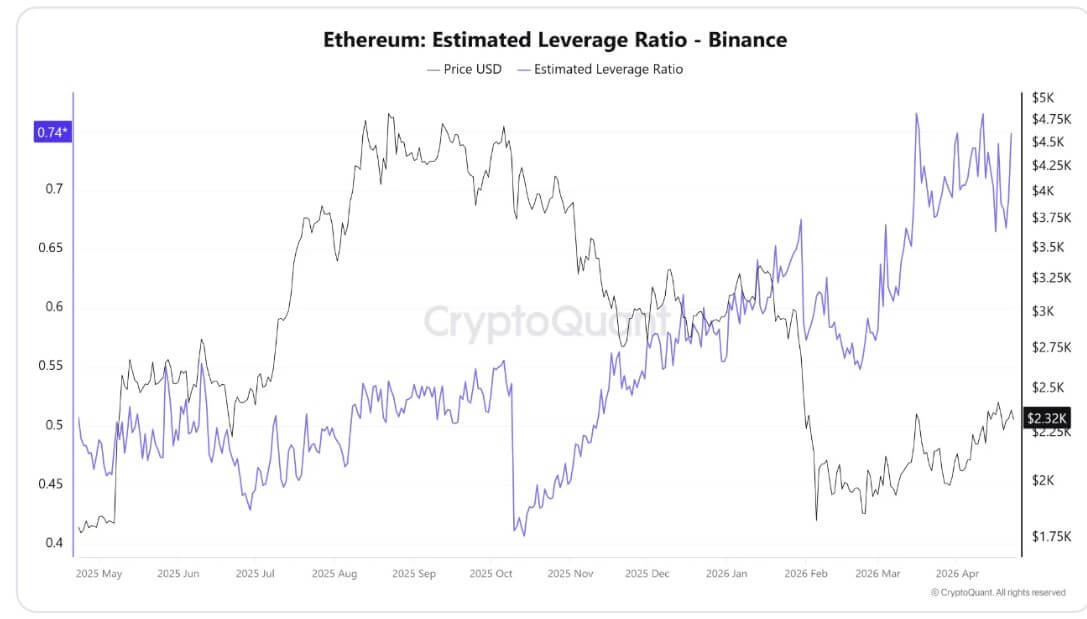
This phenomenon often emerges during initial recovery phases when traders seek to establish positions ahead of anticipated breakouts prior to full confirmation through spot flows. While such leverage can facilitate rapid gains under favorable market conditions, it simultaneously amplifies risks associated with forced liquidations should prices experience reversals.
Moreover, leveraged positions are particularly vulnerable to adverse movements; if ETH fails to consolidate its recent gains effectively, long positions may face liquidation risks—thereby exerting additional selling pressure during downturns.
This leverage signal exists alongside several constructive indicators—namely four consecutive weeks of gains for Ethereum, bullish positioning among Deribit traders targeting higher strike prices, and recent ETF inflows signaling renewed institutional appetite. However, it is imperative to acknowledge that these indicators are progressing at disparate rates.
The path toward achieving resistance at $3,200 necessitates reconciliation among these various signals; specifically: continued absorption of supply by spot buyers, stabilization within ETF flows, and moderation or cessation of leverage escalation relative to price increases.
In conclusion, without sufficient confirmation across these parameters, the very same derivative exposures propelling ETH’s rebound may exacerbate losses during instances of unsuccessful breakouts.