


Recent Bitcoin Price Fluctuations and Recovery Patterns
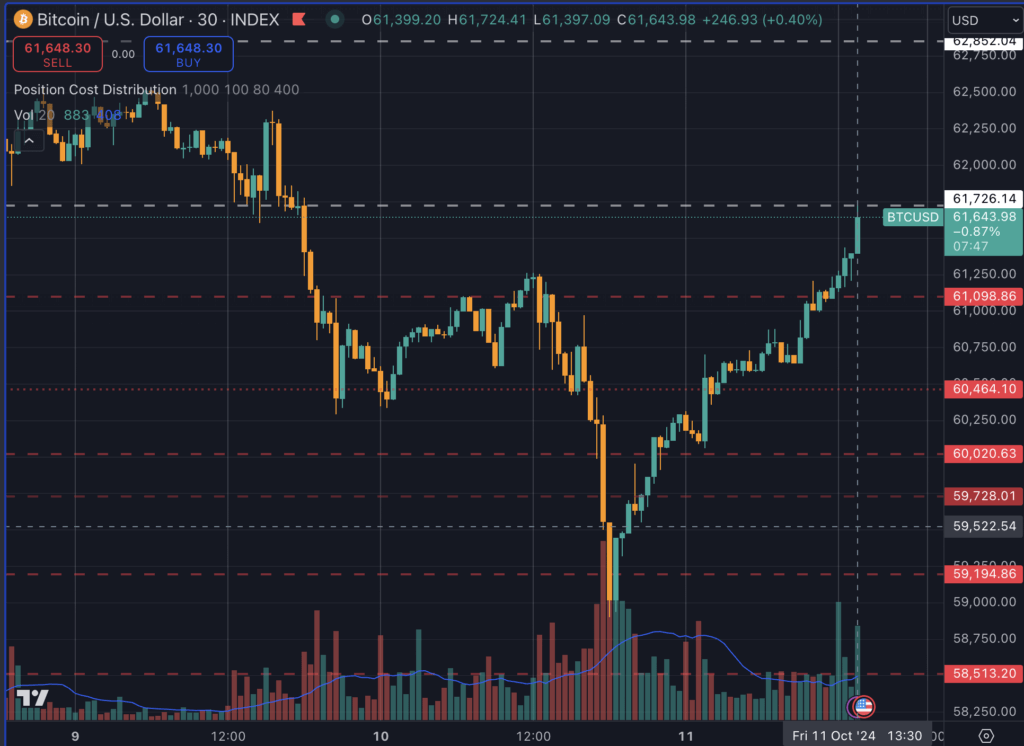
Last night, Bitcoin briefly dipped below the $59,000 mark, only to quickly rebound and regain the crucial $61,000 level. This remarkable V-shaped recovery highlights a trend observed in historical data where similar swift recoveries have often resulted in either increased gains or sideways trading, with few cases of further decline.
Bitcoin’s Recent Price Actions
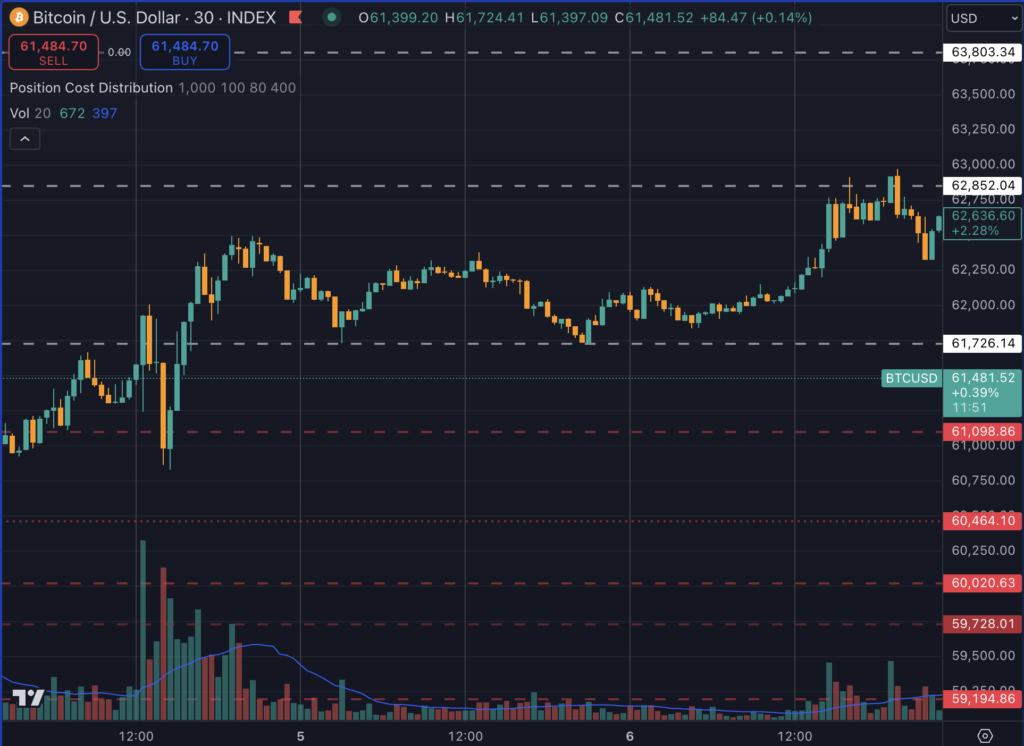
In the past week, Bitcoin saw a decline from $62,000 to around $61,000, but it quickly recovered, maintaining a position above $61,000 for several days before reaching $62,800.
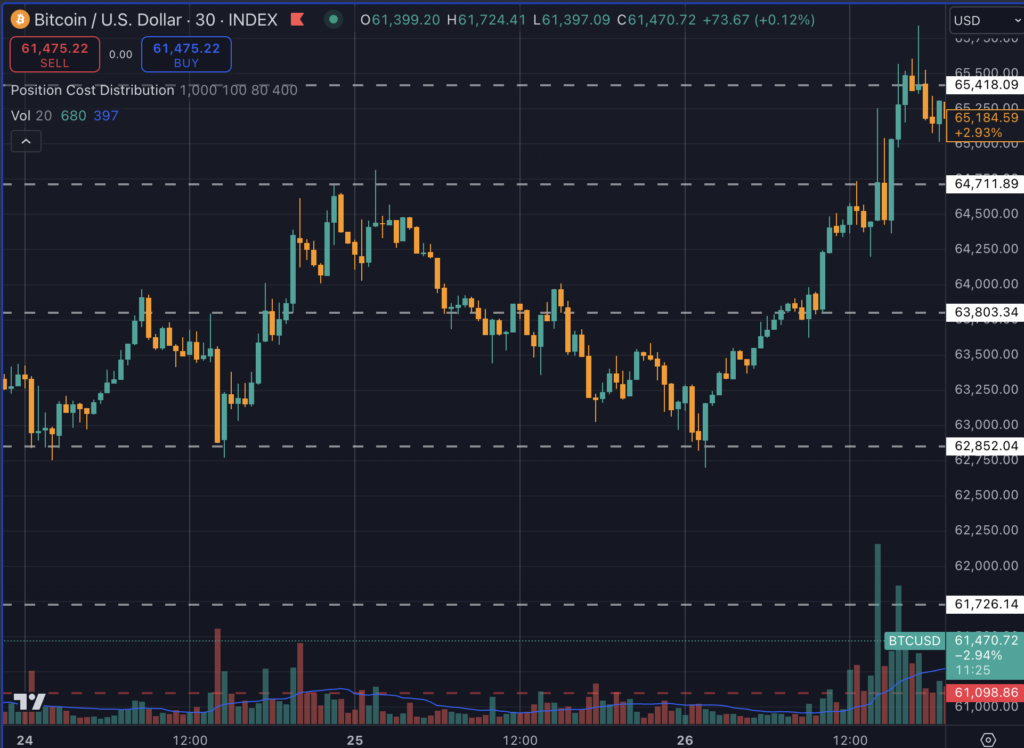
In late September, Bitcoin experienced a similar drop to $63,800 but managed to recover to $65,400, showcasing its resilience during volatile periods.
Patterns of Recovery
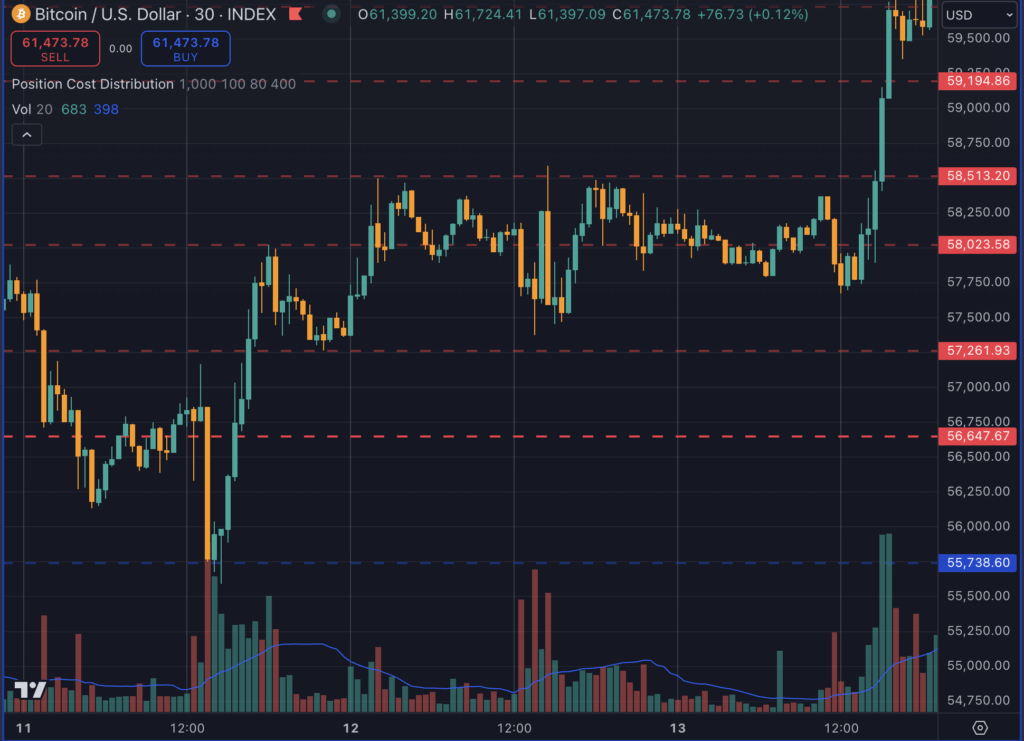
- On September 11, Bitcoin rebounded sharply after dropping from $56,600 to $55,700 within two hours, swiftly returning to near $60,000.
- Earlier in August, Bitcoin experienced a drop from $52,800 to $49,700, followed by a rapid recovery that elevated it back to $54,000, eventually reaching $58,000 over the following days.
Today’s dip below $59,000, followed by a prospective retest of the $61,700 resistance level, suggests Bitcoin is adhering to this recognizable pattern of rapid recovery and upward momentum. Such sharp rebounds often signal potential movements in price trends.
The Significance of Historical Patterns
While historical performance is not always predictive of future outcomes, the recurring nature of these rapid recoveries indicates possible stability or bullish movement following sudden dips. Observing Bitcoin’s behavior during these fluctuations can yield valuable insights into market dynamics in the upcoming days.
Since June, this V-shaped recovery pattern has become apparent, particularly after the launch of Bitcoin spot ETFs, reinforcing the importance of monitoring lower timeframes to analyze Bitcoin’s near-term movements effectively.